Industrial Sectors (new & renewal)
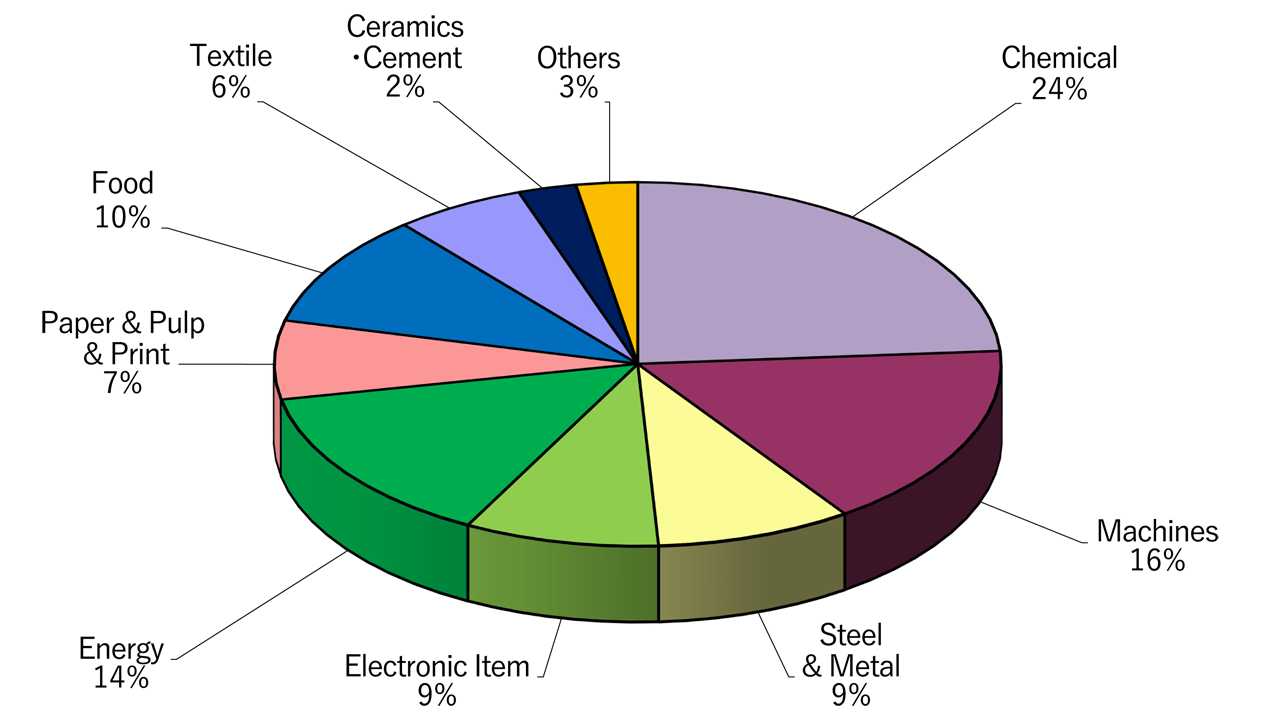
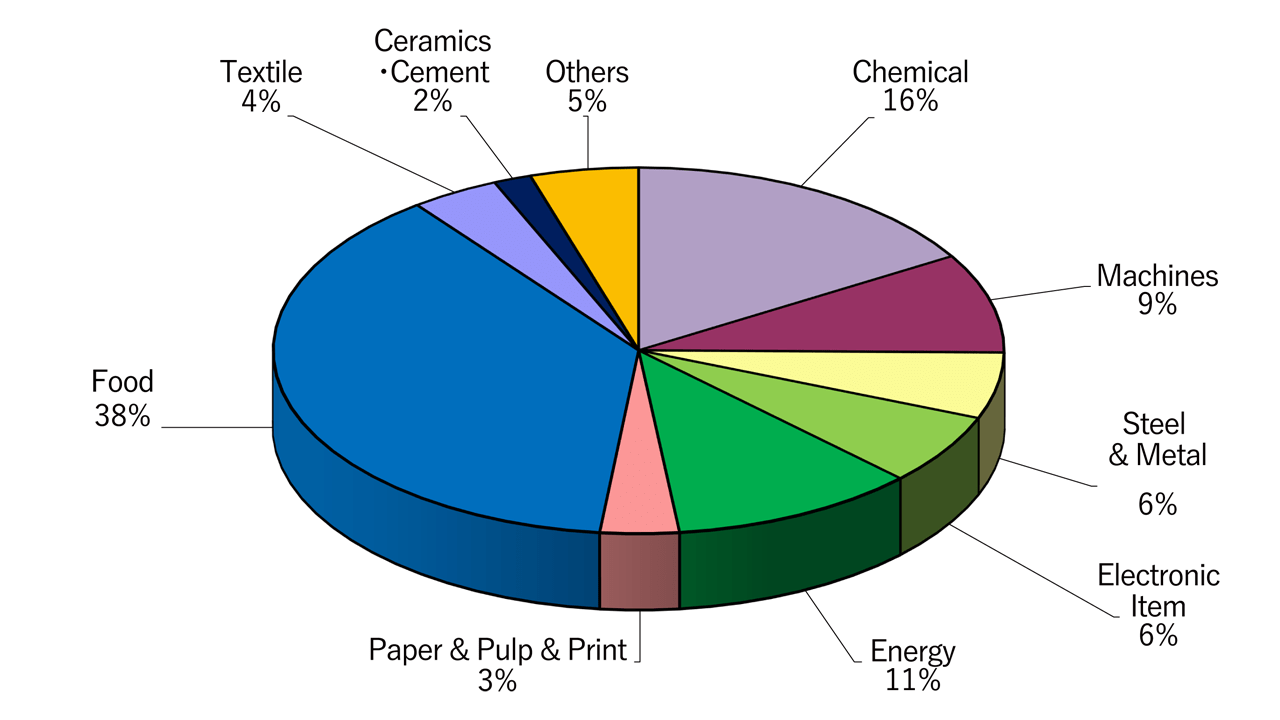
CHP Status by Industrial Sectors
in the last 10 years(as the end of March 2023)
| Sectors | Number of Installations(unit) | Electrical Capacity (MW) | Capacity per unit (kW/unit) |
| Chemical Industry | 188 | 471 | 2,506 |
|---|---|---|---|
| Machine Industry | 101 | 312 | 3,093 |
| Steel & Metal Industry | 67 | 35 | 516 |
| Electronic Item Industry | 72 | 83 | 1,146 |
| Energy Industry | 125 | 512 | 4,095 |
| Paper & Pulp & Print | 40 | 168 | 4,194 |
| Food Industry | 435 | 267 | 615 |
| Textile Industry | 45 | 81 | 1,792 |
| Ceramics・Cement Industry | 19 | 34 | 1,769 |
| Others | 55 | 38 | 696 |
| Total | 1,147 | 2,000 | - |
Share of Units by Industrial Sectors(as the end of March 2023)
Share of Capacity by Industrial Sectors(as the end of March 2023)
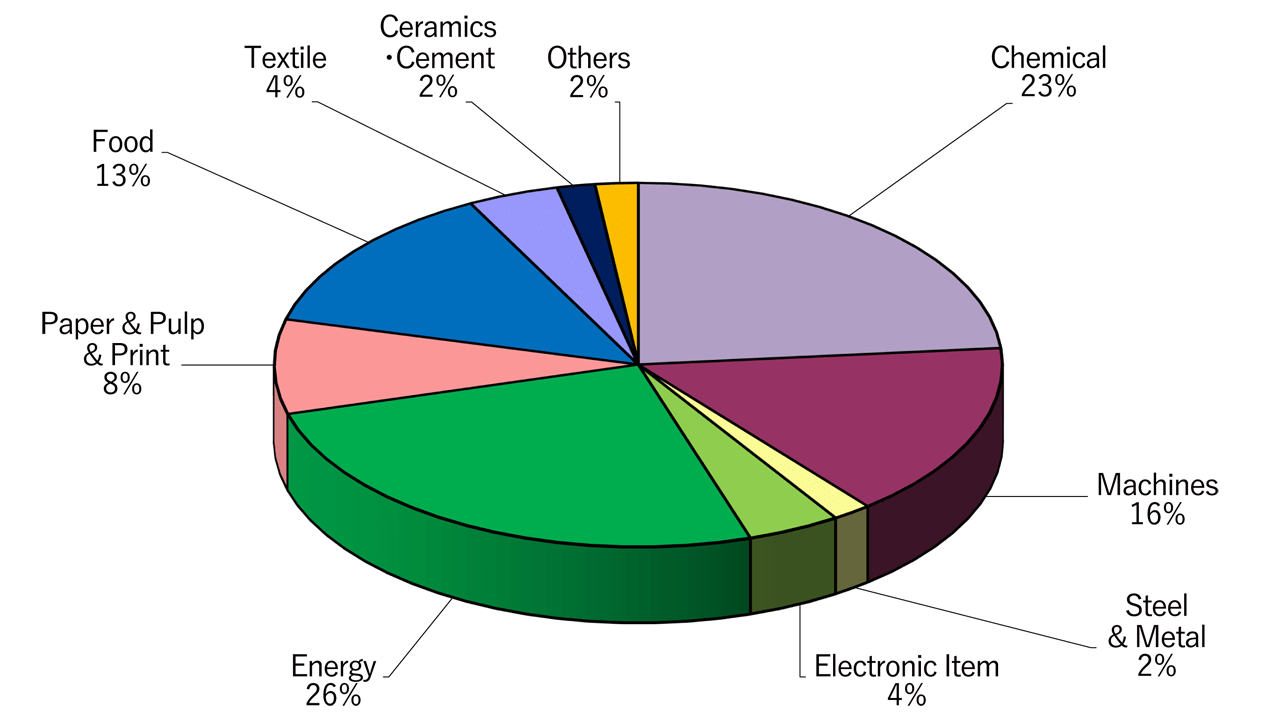
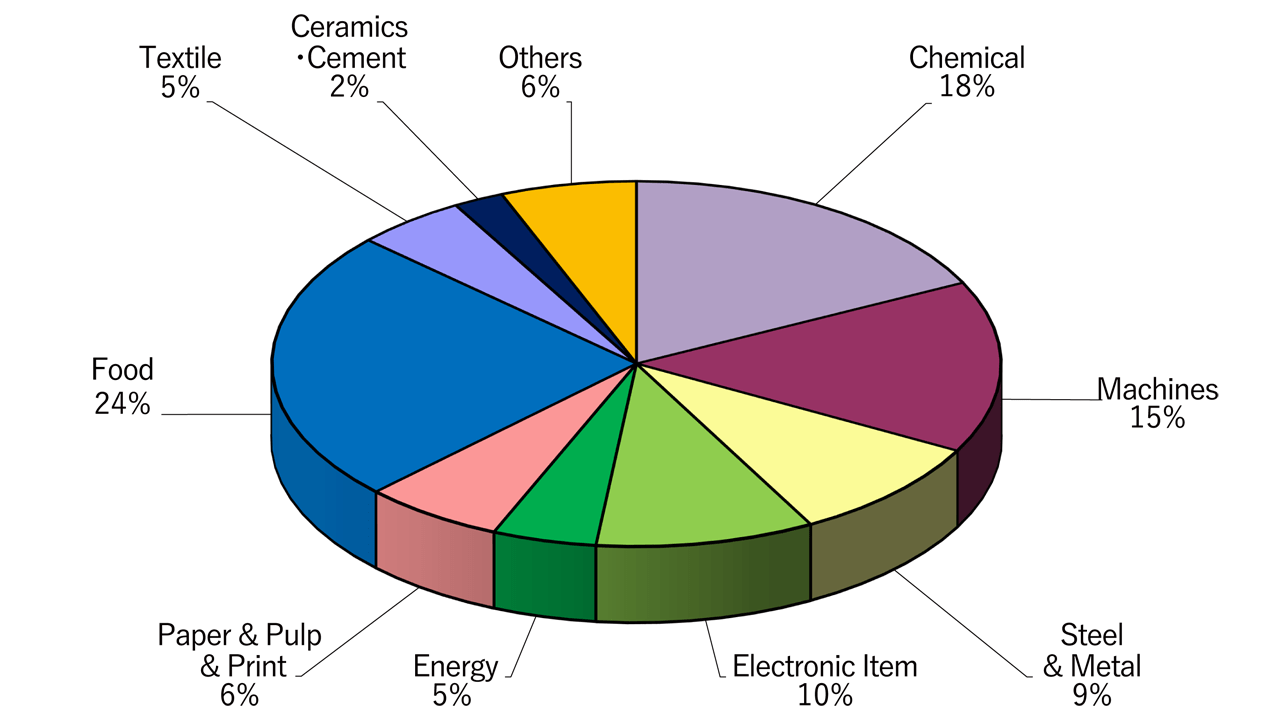
CHP Status by Industrial Sectors
(as the end of March 2023)
| Sectors | Number of Installations(unit) | Electrical Capacity (MW) | Capacity per unit (kW/unit) |
| Chemical Industry | 1,082 | 2,593 | 2,396 |
|---|---|---|---|
| Machine Industry | 932 | 1,792 | 1,923 |
| Steel & Metal Industry | 561 | 947 | 1,689 |
| Electronic Item Industry | 593 | 939 | 1,583 |
| Energy Industry | 282 | 1,534 | 5,440 |
| Paper & Pulp & Print | 383 | 759 | 1,983 |
| Food Industry | 1,480 | 1,090 | 737 |
| Textile Industry | 301 | 632 | 2,098 |
| Ceramics・Cement Industry | 136 | 280 | 2,058 |
| Others | 369 | 297 | 804 |
| Total | 6,119 | 10,863 | - |
Share of Units by Industrial Sectors(as the end of March 2023)
Share of Capacity by Industrial Sectors(as the end of March 2023)